
America’s Highest-Paying Interior Design Clients
If you’re building a serious interior design firm in the U.S., revenue doesn’t come from “everywhere.”

America’s Highest-Paying Interior Design Clients
If you’re building a serious interior design firm in the U.S., revenue doesn’t come from “everywhere.” It clusters.
This breakdown identifies:
Top-paying regions
Estimated market share %
Services driving the highest fees
Typical project spend
Median household income (buying power indicator)
Citable data sources
All figures reflect the most current industry releases and data sources.
🇺🇸 A Snapshot
Total U.S. Interior Design Industry Revenue: ~$18–20+ billion
Number of firms: ~75,000+
Average firm revenue: ~$250K–$300K (high variance)
Luxury & high-end residential = fastest growing profit segment
Primary data sources:
IBISWorld – Interior Designers in the US (2024–2025)
U.S. Census Bureau – Service Annual Survey (NAICS 54141)
Bureau of Labor Statistics – Occupational & wage data
Grand View Research – U.S. Interior Design Market Forecast
Houzz – Renovation & Design Trends Study
🥇 1. West Region (California + Pacific Northwest)
Market Share: ~30–33% of U.S. revenue
Estimated Annual Spend: ~$6–7B
Major High-Revenue Cities
Los Angeles
San Francisco
San Diego
Seattle
Median Household Income
California median: ~$91,000
San Francisco metro: ~$136,000+
Seattle metro: ~$120,000+
Best-Paying Segments
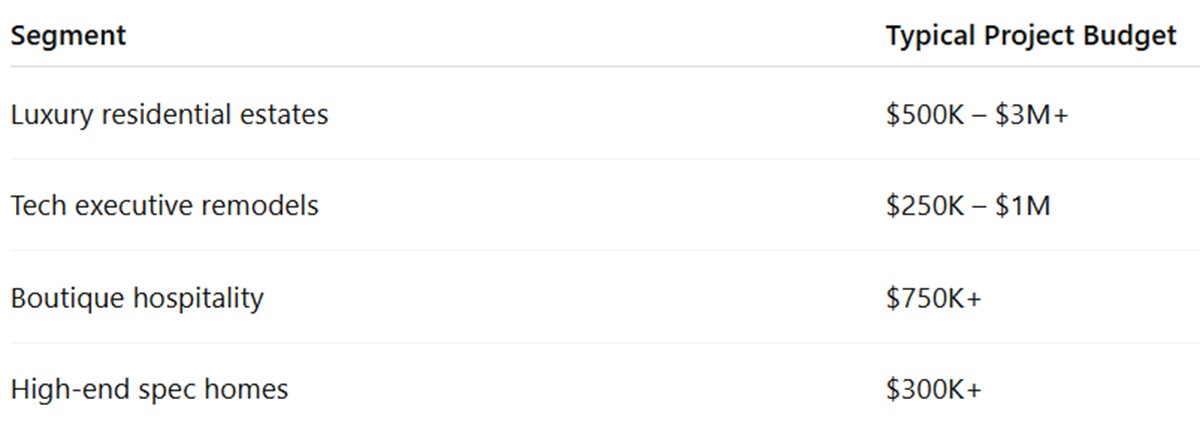
Why It Pays
Concentration of tech wealth
Entertainment industry (LA)
High property values
Strong luxury culture
California alone is estimated to generate roughly 20%+ of total U.S. interior design revenue.

🥈 2. Northeast (NY, NJ, MA, CT)
Market Share: ~22–25%
Estimated Annual Spend: ~$4–5B
Revenue Hubs
New York City
Boston
Median Household Income
New York State median: ~$79,000
NYC metro: ~$95,000+
Boston metro: ~$110,000+
High-Revenue Services
Luxury apartment redesign
Pre-war brownstone renovations
Commercial office interiors
High-end retail & hospitality
Typical Budget Ranges
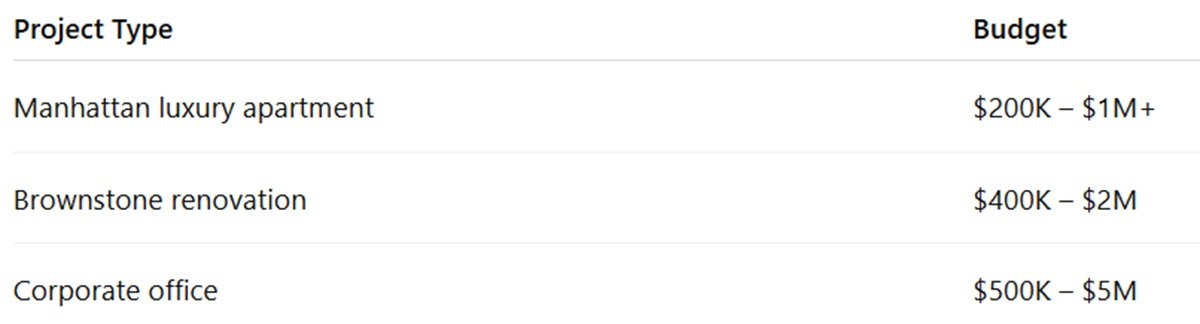
Northeast clients value prestige, architecture, and legacy properties—often resulting in high per-project margins.
🥉 3. South (Texas, Florida, Georgia)
Market Share: ~28–30%
Estimated Annual Spend: ~$5–6B
Key Cities
Miami
Austin
Dallas
Atlanta
Median Household Income
Texas median: ~$75,000
Florida median: ~$67,000
Austin metro: ~$103,000+
Why the South Is Exploding
Population growth
Luxury condo development (Miami)
Corporate relocations (Texas)
Large suburban custom homes
High-Paying Segments
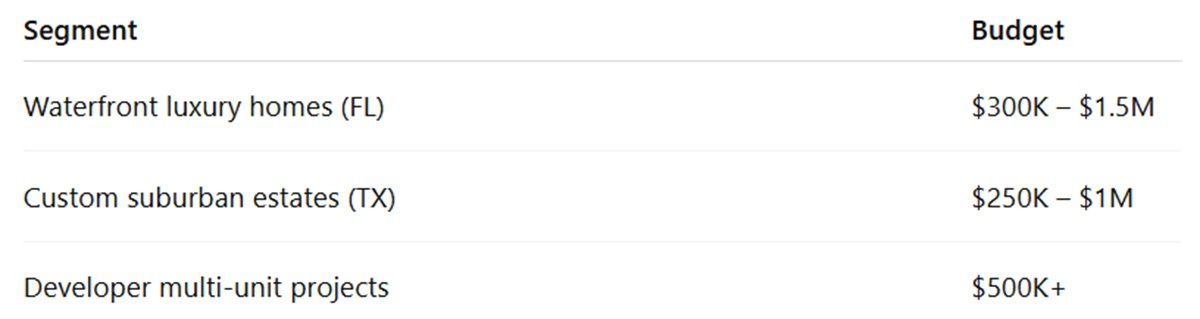
Miami has become a luxury design powerhouse due to international buyers.
🏢 4. Midwest
Market Share: ~15–18%
Estimated Annual Spend: ~$3B
Key Cities
Chicago
Minneapolis
Median Household Income
Illinois median: ~$76,000
Chicago metro: ~$90,000+
Spending Patterns
Lower average project size than coastal markets
Strong commercial & healthcare design
Large suburban residential remodels
Typical residential projects: $50K–$250K.
💎 Where the Highest Paying Clients Actually Are
If “best-paying” = highest project values + repeat contracts:
Tier 1 Markets
Los Angeles
San Francisco
New York City
Miami
Tier 2 (Fastest Growth)
Austin
Dallas
Seattle
Boston
💼 Service Breakdown (National Revenue Share)
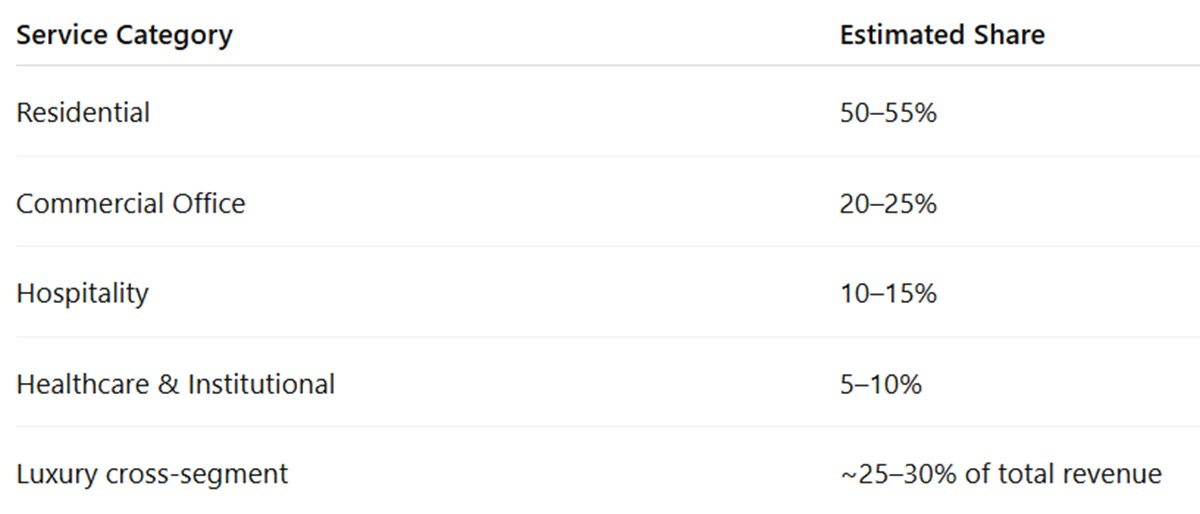
Luxury and high-end residential drive the largest profit margins.
💰 Median Income vs Spending Correlation
Interior design revenue strongly correlates with:
Metro median income above $100K
Property values above $800K
High concentration of $1M+ homes
Corporate headquarters density
High-income ZIP codes produce disproportionately large projects—even when overall state median income is moderate.
Strategic Takeaways for Firms
✔ West + Northeast = highest per-project revenue
✔ South = fastest scaling opportunity
✔ Midwest = stable but lower ceiling
✔ Luxury residential + hospitality = strongest margins
✔ Developers and repeat commercial contracts create revenue stability
If your goal is seven-figure annual firm revenue, focus on:
Top 20 U.S. metros
Affluent ZIP codes
Builder + developer partnerships
Luxury positioning (not mid-market competition)
Data Sources (For Citation)
IBISWorld – Interior Designers in the US Industry Report
U.S. Census Bureau – Service Annual Survey (NAICS 54141), Median Household Income Tables
Bureau of Labor Statistics – Wage & employment data
Grand View Research – U.S. Interior Design Market Forecast
Houzz – U.S. Renovation & Design Trends Study